Key Performance Indicators
Our Growth,
Redefined by AI
FY25 was a year of focused execution and strategic progress for Mastek. We delivered consistent growth across key markets, deepened client engagement, and advanced our AI and digital transformation capabilities.
Strengthened by a robust delivery engine and a future‑ready talent pool, we step into FY26 with reinforced confidence in our ability to drive innovation, scale impact, and create lasting value for all stakeholders.
Profit and Loss Metrics
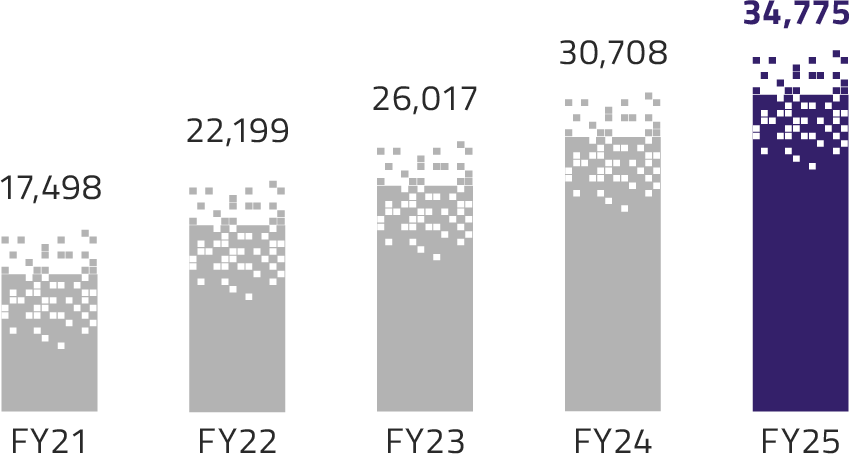
Total Income (INR in million)
18.7% CAGR
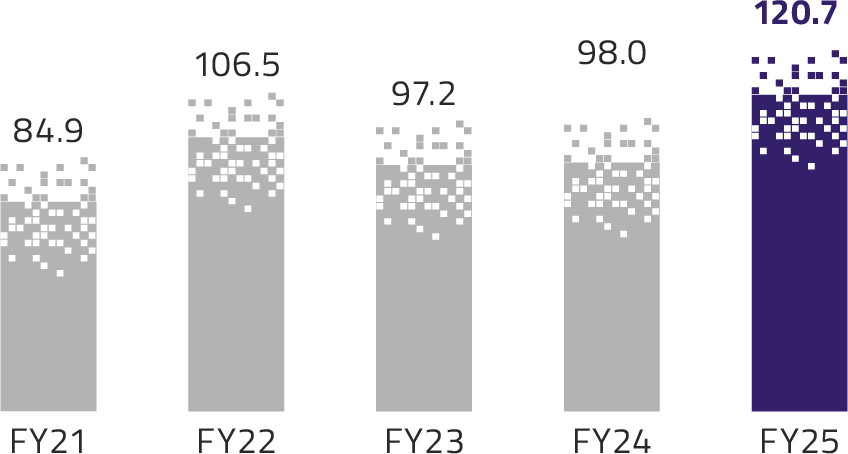
EPS (Basic) (INR)
9.2% CAGR
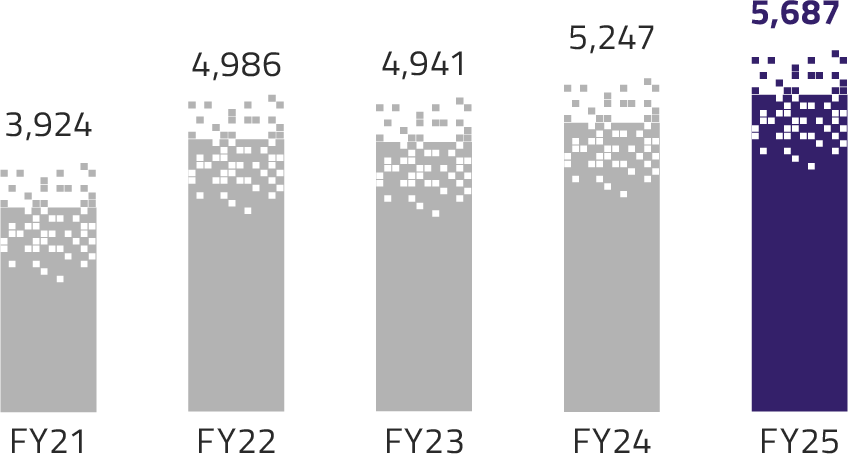
Total EBITDA (INR in million)
9.7% CAGR
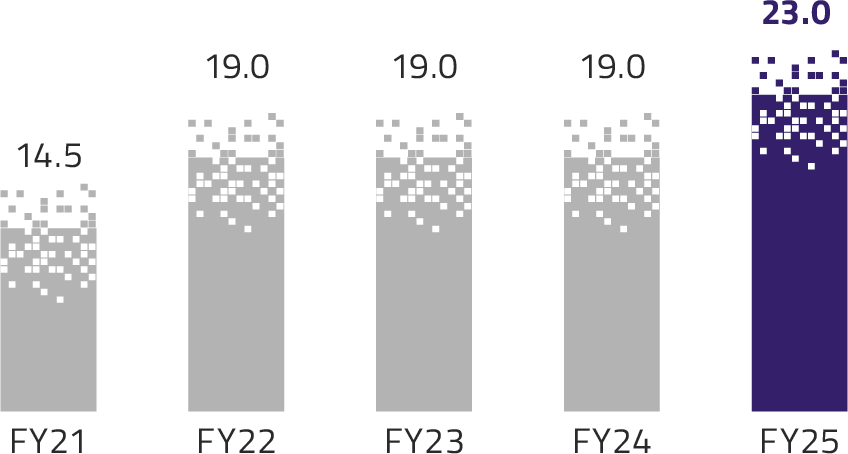
Dividend Per Share (INR)
12.2% CAGR
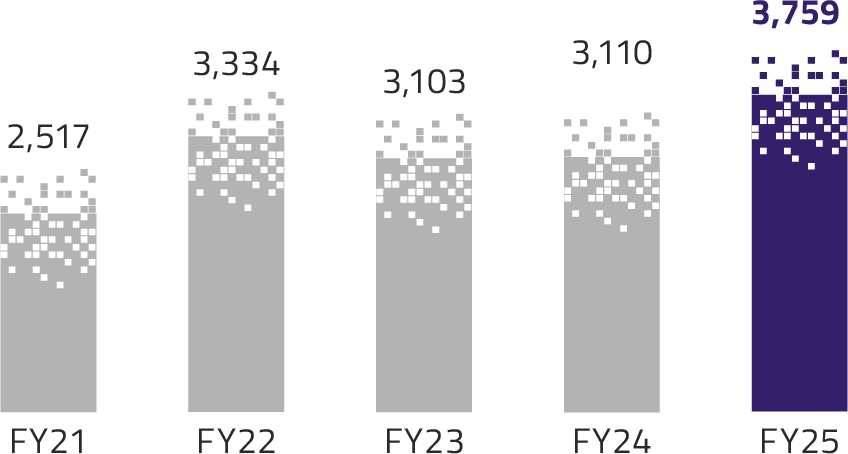
Net Profit (INR in million)
10.5% CAGR
Balance Sheet Metrics
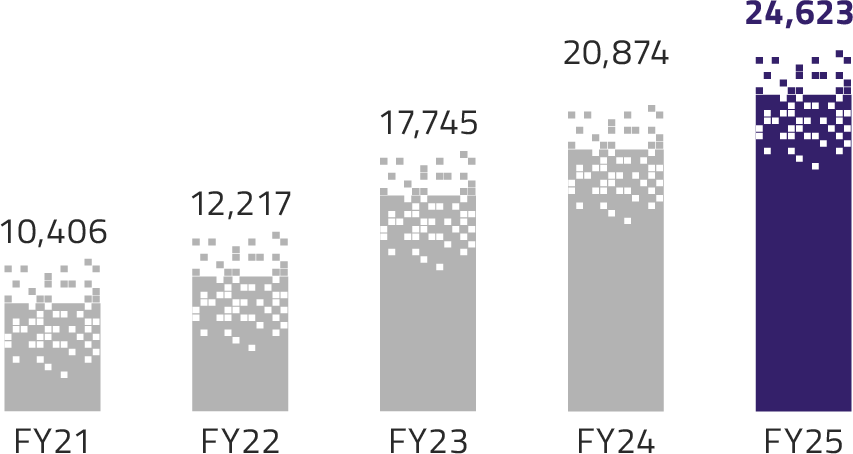
Net Worth (INR in million)
24.0% CAGR
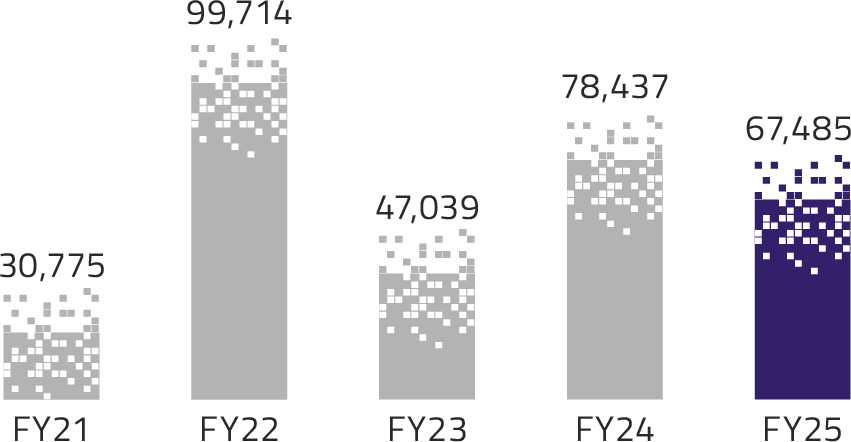
Market Capitalisation (INR in million)
21.7% CAGR
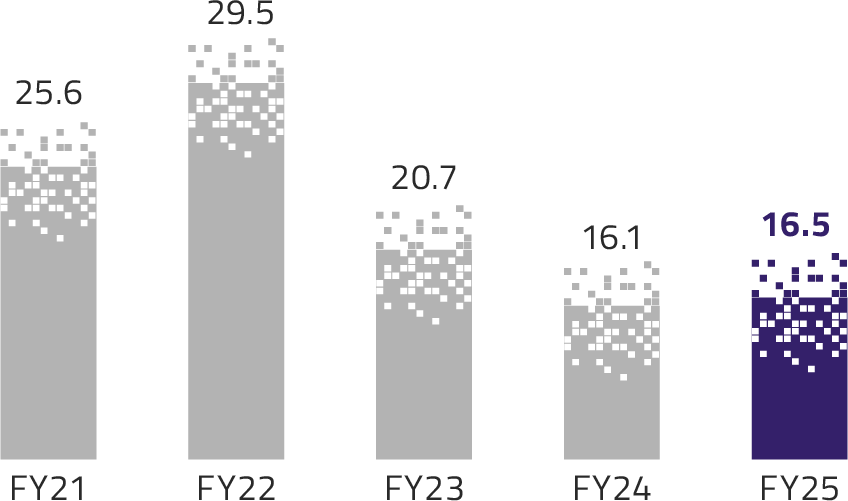
Return on Equity (%)
Operational Metrics
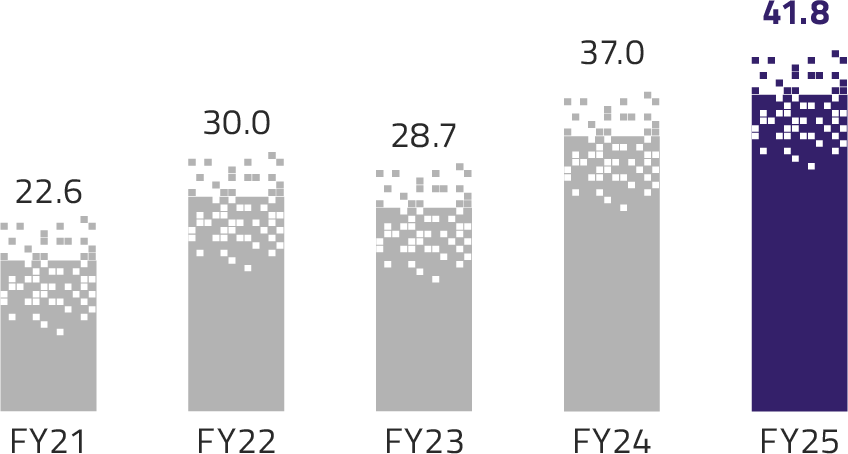
CSR Spend (INR in million)
16.6% CAGR
GHG Emissions at Mastek UK
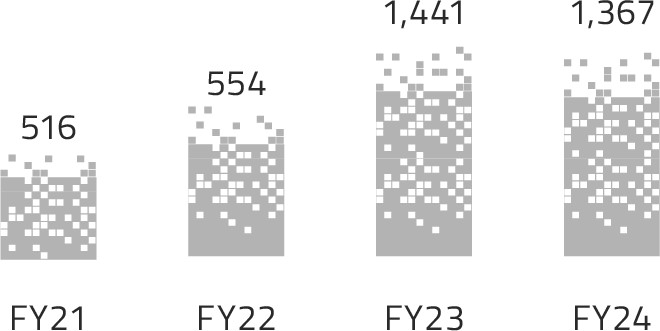
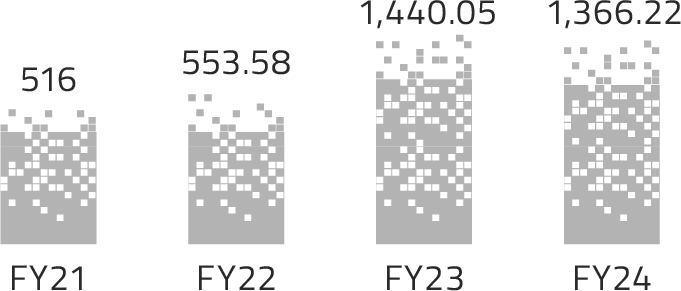
Total Emissions (tCO2e)
Total Offset (tCO2e)